Long-term Inflation Regimes

Inflation regimes are so long that an entire generation of investment professionals, coming of age in one cycle are unprepared for a shift in the regime. Assets behave quite differently when inflation is low or moderate compared to when inflation is high. US Treasury bonds are generally considered safe havens. Bonds are expected to have low volatility regardless of equity risk and go up when stocks go down making them a proxy hedge for equities. Unfortunately that’s only true when inflation is low or moderate. In a high inflation regime they become a completely different asset class. The bond correlation with stocks often goes up and volatility increases to equity like levels. Bonds are not reliable proxy hedges for equities when inflation is high. When inflation is very high commodities often lose their inflation hedging properties as well. So it would be a good idea to know when the inflation regime is changing since it does have such a dramatic change in the characteristics of many asset classes.
Because of the long term nature of inflation regimes, many overly simplistic ideas become accepted as fact. Such as raising interest rates always combats inflation. Or inflation is caused by excessive government spending. While those ideas can be true under certain circumstances, they are not true much of the time too. I’ve written extensively about inflation, particularly in a series of three papers under the general title of The Many Personalities of Inflation available in the newsletter section. I’m going to give an introduction to these concepts here, but I strongly recommend reading those papers if you want a more in-depth explanation.
Types of Inflation
People, even investment professionals, tend to over simplify the concept of inflation. It’s true that inflation is simply rising prices. But it’s also true that heart attacks are caused by the improper functioning of the heart. But what causes the heart disease that leads to heart attacks? We could simply say its high blood pressure and that’s caused by too much salt in your diet. So we would always treat heart disease by reducing salt in the diet. That’s absurd, of course. There are many reasons for heart disease besides salt. Smoking cigarettes, for instance, damages the walls of your blood vessels, making the arteries narrower and putting more pressure on the heart. Fatty foods do the same thing. So salt alone may not be the problem.
Inflation is a lot like heart disease in that there are many causes. Like heart disease, if you treat the wrong cause you will likely not have a desirable result.
Inflation can be caused by:
Increased demand,
Decreased supply, and
Increases in the money supply.
Of these the most common is inflation due to increases in demand. As the economy expands and unemployment is low, there is increasing demand for goods and services with demand outstripping supply. In this case demand can be reduced by tighter monetary policy and increasing taxes. Since elected politicians are not anxious to raise taxes, they leave it to the central banks to reduce demand by raising interest rates. This was largely the type of inflation we have seen since 1983 and the response is a similar tightening of monetary policy. The objective is a “soft landing” where the central banks slow the economy enough to reduce demand but not cause a recession. Historically this has worked quite well though in most cases we have a shallow recession rather than a soft landing. Inflation due to decreased supply is more of a problem. Monetary and fiscal policy cannot improve supply. So the only response is the reduce demand to the level of supply, but that can mean a more serious recession. If the inflation problem is decreased supply, it is unreasonable to think that a shallow recession will solve the problem. Usually it needs to be a more severe recession.
Monetary inflation is highly feared because most instances of very high inflation are caused by government spending leading to an increase in the money supply. Since, in the US, the very high inflation of the late 1970s is often tied to runaway government spending, many simplistically think that all deficit spending is inflationary and bad for the economy. Unfortunately, or fortunately, that’s not completely true. We’ve seen in Japan that running very large deficits has not brough them out of a continually low inflation environment, even in the aftermath of the Pandemic of 2020. The US ran large deficits in 2009 but still experienced a sluggish economy and low inflation. So in 2022 inflation began spiking after a large increase in government spending and an increasing money supply. That must mean that we’re experiencing monetary inflation, right? Not necessarily. Increases in the money supply alone do not result in monetary inflation as we’ve seen in Japan. The velocity of money must also increase. That means the money circulating through the economy should be growing faster than the economy. After all, the idea behind monetary inflation is too much money chasing too few goods. In the US the velocity of money steadily fell after the large deficits of the Global Financial Crisis of 2008 and then collapsed after the massive outlays for the COVID-19 pandemic and have yet to recover as seen from the graph below despite large deficits to combat both crisis’s.

From the St Louis FRED website:
“Velocity is a ratio of nominal GDP to a measure of the money supply (M1 or M2). It can be thought of as the rate of turnover in the money supply--that is, the number of times one dollar is used to purchase final goods and services included in GDP.”
This points to the problem that I discuss in the “Many Personalities of Inflation” papers. It’s difficult to know exactly what’s causing inflation while it’s happening. But if we want to know that the inflation regime itself is changing, there are a number of indicators we examine.
The Long-Term Inflation Level Regime Indicator (ILRI)
Since it is difficult to ascertain whether the inflation level has shifted regimes, I decided to look at a number of different types of inflation indicators and determine where they are relative to their history. I’ve tended towards US numbers since those numbers have been compiled for several decades. The sub-indicators fall into three types:
Headline Inflation: While headline inflation is old news because its backward looking, investors and the public anchor onto these numbers in the behavioral finance sense.
Near-Term Inflation: The portion of the above which represent goods and services used as lower cost substitutions when inflation is rising.
Long-Term Trend Inflation: Derivations of headline inflation which reflect the underlying inflation trend. Reflecting whether the direction of inflation has changed.
Each indicator is divided into quartiles signifying four inflation regimes: low, moderate, high and very high. The combination based on similarity as explained in the Constructing Cycle and Regime Indicators section. This approach is similar to looking at the level of CO2 in the atmosphere to define climate ages. Inflation is both the temperature and CO2 of the inflationary regime/age.
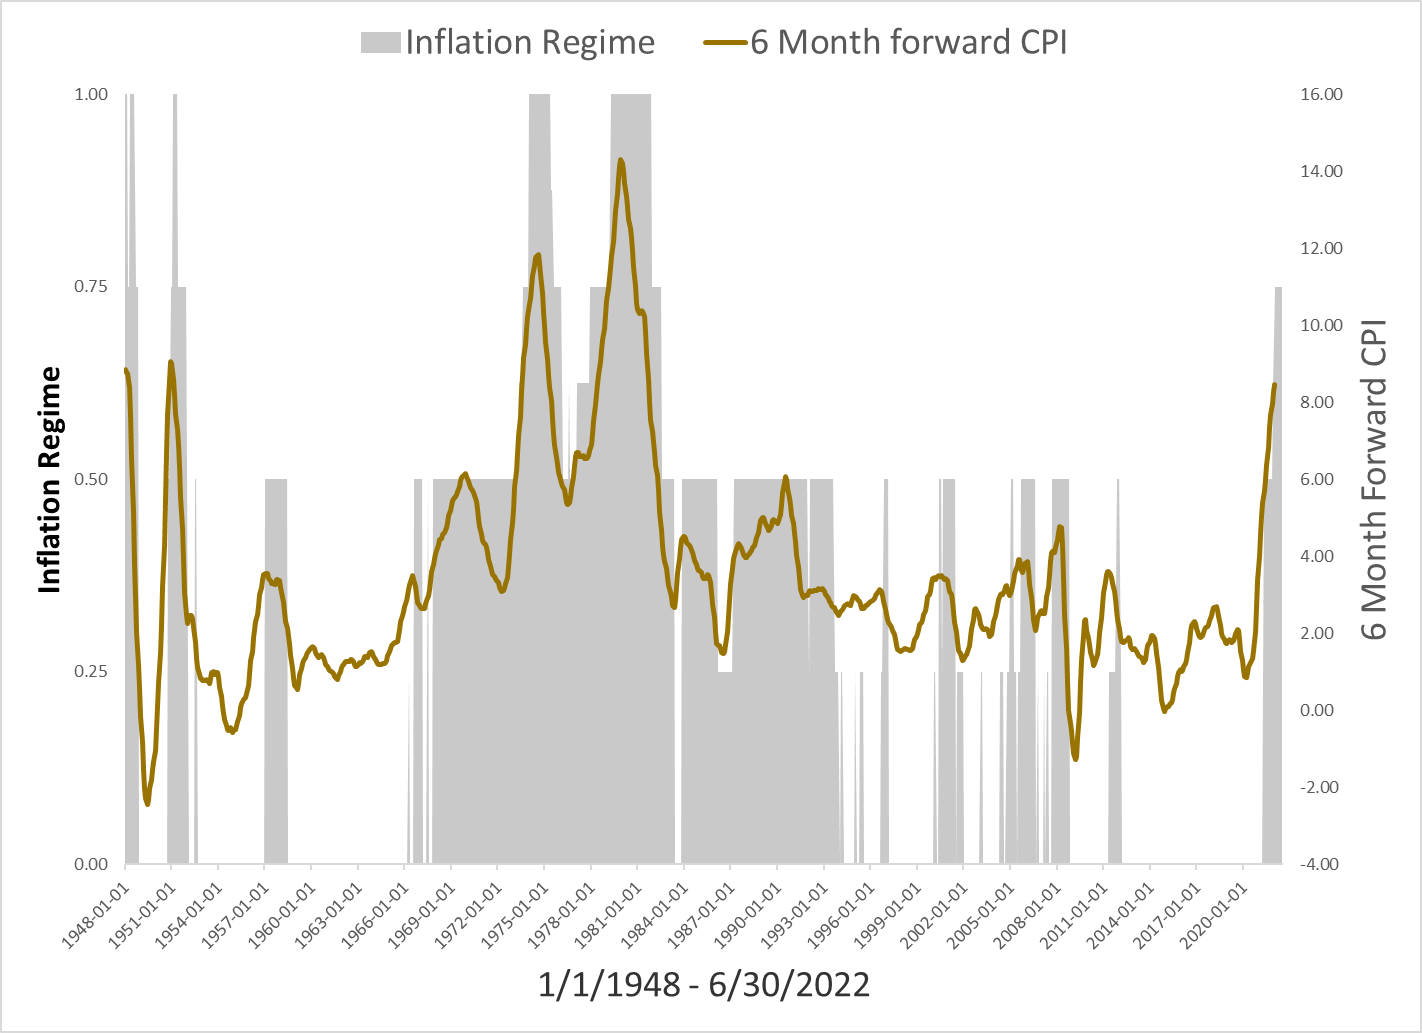
The Inflation Regime Indicator from 1948 - June 2022. The “6 month forward CPI” is the headline CPI 6 months in the future. The IRI can be read as follows: <0.50 = Low, 0.50 = Moderate, 0.75 = High, and 1.00 = Very High.
Plotting the IRI vs. 6 month ahead inflation shows how effectively the indicator anticipates changes in the inflation regime.
Source: St. Louis Fed, FMCR Analytics